
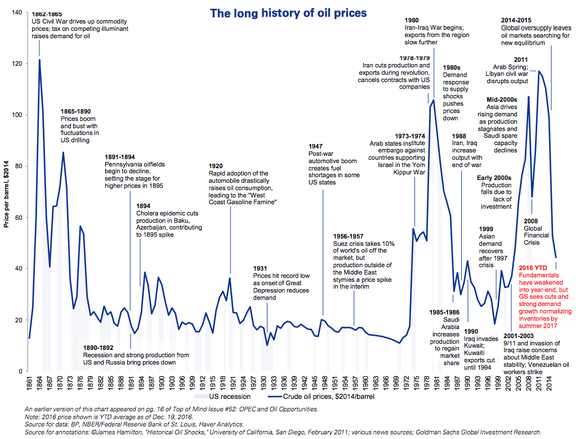
Oil Price: Market Scenario
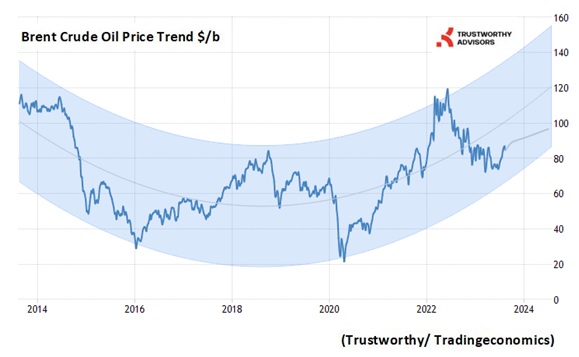
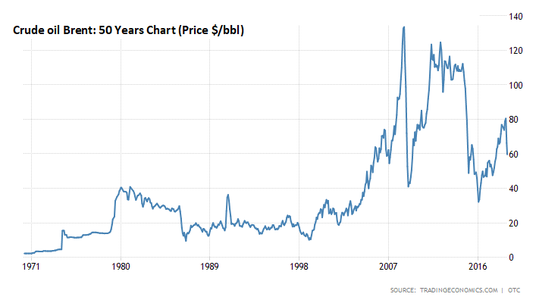
Oil price has always remained volatile and uncertain especially since last ten years. Brent crude had fallen by over 75% from $115 in June 2014 to $26 a barrel in January 2016. Since then, oil made efforts to recover but could not sustain and even went below zero dollar for a while in early 2020.
OIL PRICE: Which Way?
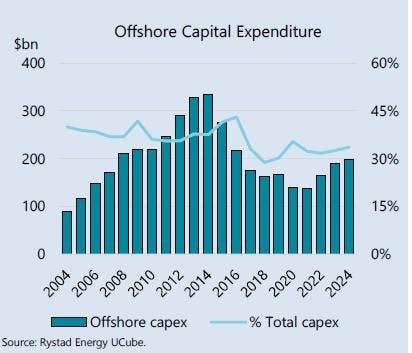
1. Global economy slowdown and Covid-19 had pulled down oil price to $20/b in early 2020. This resulted in underinvestment in oil fields for 3 years.
2. Post Covid, world oil demand is climbing and in current year expected to record annual average of 102.2 mb/d, its highest ever annual level as per IEA’s estimates.
3. But oil production could not keep up with recovering demand, putting an upward pressure on oil price. Further, the geopolitical tension with Russia over Ukraine fuelled the Oil Price, Brent touching even $120 with an average of $100 per barrel in 2022, a big jump from $55 in 2020.
4. Global oil output is projected to record 101.5 mb/d in 2023, with the almost matching contribution by OPEC+ and non-OPEC+.
5. The production cuts by OPEC+, combined with increasing demand, will cause global oil inventories to fall and to put upward pressure on oil prices through the end of this year.
6. Global macro models and experts’ projections indicates the price to hover around $85 plus minus 10% in short term.
7. US EIA expects to have annual average of $83 in 2023 and increase to $87 next year average .
8. There seems more upside than downside for oil prices in medium term.
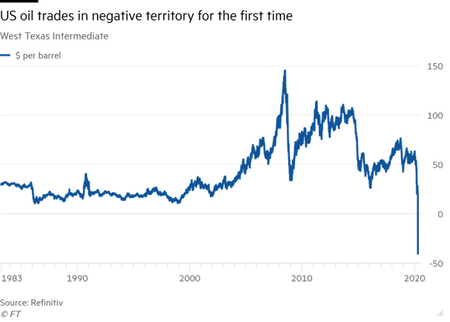
US OIL PRICE BELOW ZERO FOR THE FIRST TIME IN HISTORY: WHAT HAPPENED?
1. Too much oil, with nowhere to store it.
2. The coronavirus pandemic has caused global demand to collapse.
3. No buyers were willing to take delivery of crude against the WTI futures (May month contracts) because there is no place to store it. The negative price simply means the US producers are ready to pay buyers to take oil off their oil-fields.
4. However, Brent crude does not have the same storage issues for the time being. Brent, being mostly a seaborne crude, traders can put it on ships and move it around the world immediately. The Brent price also declined due to panic in the oil market. Currently, Brent is trading below $20 and WTI below $15.
5. The continued fall in oil prices has come despite an OPEC and Russia+ deal to cut roughly 10% of global crude supply to stabilize price above economical level.
6. While global oil consumption is likely to be lower by around one-third for one year or so, a 10% production cut cannot stabilize the oil price as per the basic supply and demand curve, in economics. The US Shale oil producers will have to curtail production.
When will the oil price stabilize?
In November 2016, OPEC agreed to reduce output. It kept its promise of oil output cut. Crude production was reduced by about 1million bpd to 32million bpd in January 2017. This was one of the deepest in the history of output cut initiatives by the cartel. Russia has also been able to reduce supply faster than expected. Oil Producers together have already removed 1.8 million barrels a day from the market.
The oil ouput cut which was initially for the first half of 2017 was extended r beyond six months and subsequently for the current year 2018 also.
OPEC and Russia are now working on a long-term deal to cooperate on oil supply curbs that that began in January 2017. They are considering an alliance that shifts from a year-to-year agreement to a 10-20 year agreement. This may partially reduce price instability.
These deals boost the expectations in the market that the inventory overhang will be cleared and push oil prices up. Brent is hovering between $50-$70 a barrel since January 2017 with an upward trend.
Hedge funds too have turned optimistic and are amassing the biggest ever bet on rising oil prices. Data from regulators and exchanges show the speculative investors holding a record net long position — the difference between bets on rising and falling prices — equivalent to almost 1bn barrels of crude in futures and options contracts.
But as OPEC and Russia are cutting output, increase in oil price is making US shale industry more attractive. Drilling is ramping up; the number of drilling rigs deployed is increasing. Low oil price regime made shale producers more efficient and adopt cost-cutting techniques. Most of them are viable at $45 a barrel and can generate more demand for oilfield services. Drillers and frackers will be able to bargain for higher rates.
With a continued focus on high-tech and improving efficiency, U.S. oil production has already surged above its 1970 “peak” of 9.6 million barrels per day. The Energy Information Administration (EIA) estimates that its oil production will average 10.6 million bpd in 2018 and will rise further to 11.2 million barrels a day in 2019. This may counter balance the planned cuts by others and partially fill in gaps.
But Speculators react to even small developments in the physical markets, which creates temporary instability in the market. Brent crude had fallen by over 75% from $115 in June 2014 to $26 a barrel in January 2016. During this period, oil made efforts to recover and even reached near $70 but could not sustain and declined again and again.
The continued developments in crude oil production senerio and OPEC strategy are expected to bring some balance to the market and avoid extremes like $25 or $115. Except for any unforeseen events, these factors are likely to keep oil price moving between $55 and $75 in 2018; a range considered comfortable for both producers and consumers.
(Trustworthy’s article as published in ET Energyworld: Feb 14, 2017, and updated until March 2018)
India’s Natural Gas Production Outlook:
Government has fixed target
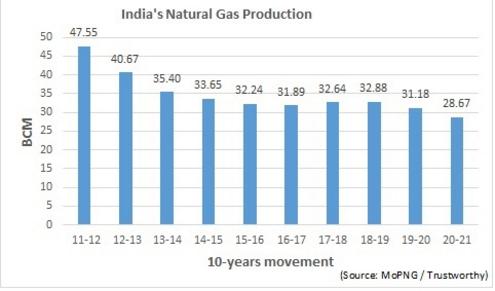
To ramp up Domestic Gas production to 50 BCM in next 3 years from last 3 years average of 31 BCM.
To raise the share of natural gas in the country’s primary energy mix to 15 per cent by 2030 from the present level of 6 per cent. Global average of gas share in energy mix is 24%.
Domestic gas production faced a steep decline from 48 BCM to around 32 in 10 years. Last year, Coronavirus pulled down it drastically below 29 BCM.
The Challenges ahead:
Gas price for nominated blocks, fixed based on the global average price at the hubs in the US, UK, Canada and Russia, has declined from $5 per million Btu to a low of $1.79 in six years.
Similarly, the price of Gas from Deepwater and other difficult areas though discovered through a bidding process, is subject to a cap/ ceiling of $3.62.
The Gas prices fixed or caped through Gas Pricing Formula are commercially neither viable for the existing gas producers nor attractive for new investors. Gas pricing policy needs a revisit to attract entrepreneurs and capital.
Long Term consistent assured production and supply of the Gas to the Industry is the Key to become a gas-based economy.Type your paragraph here.
The oil price has always remained uncertain and volatile, especially for the last five years. Brent crude had fallen by over 75% from $115 in June 2014 to $26 a barrel in January 2016. Since then, oil is making efforts to recover and but with wide fluctuations in the short-term.
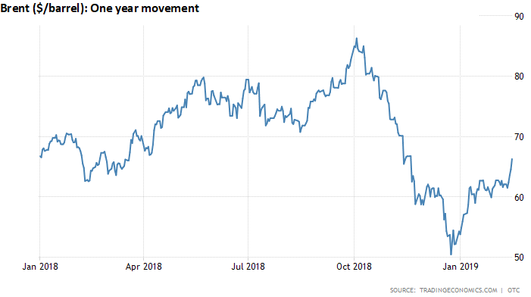
The price of oil went on a wild ride in 2018, surging 30% before collapsing 40% from the peak, ending the year down 20%. The geopolitical factors kept oil prices moving in a wider range between $50 and $75 in 2019.
Producers, consumers, and investors all continue to watch the daily price movement graph with fear and hope.
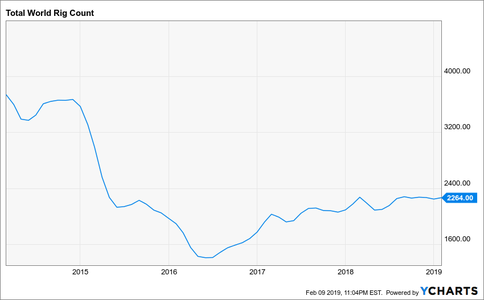
The Global Rig Count, which had dipped to 1400 in mid-2016, has started picking up and crossed 2250, though still far away from the 3600 marks prior to 2014 downturn. The Rig Count Index is considered an important indicator of the oil and gas industry activity.
Oil majors post strong profits, 13% higher in 2108 compared to 2014
The five largest oil companies, Exxon Mobil, Shell, Chevron, BP and Total, popularly known as Big Oil, made impressive earnings of $84 billion in 2018.
This is a remarkable achievement, as the average crude price in 2018 was significantly lower at $71 a barrel than $100 price four years ago. The big oil companies have demonstrated how to operate in the low price environment. The companies have restructured their businesses, sold off non-core assets, improved efficiency through new technologies and positioned themselves to thrive even when crude prices swing up and down wildly.
A positive signal for oil companies and oilfield service providers.
INDIA’S NATURAL GAS PRODUCTION OUTLOOK
India’s Natural Gas Production Outlook:
Government has fixed target
To ramp up Domestic Gas production to 50 BCM in next 3 years from last 3 years average of 31 BCM.
To raise the share of natural gas in the country’s primary energy mix to 15 per cent by 2030 from the present level of 6 per cent. Global average of gas share in energy mix is 24%.
Domestic gas production faced a steep decline from 48 BCM to around 32 in 10 years. Last year, Coronavirus pulled down it drastically below 29 BCM.
The Challenges ahead:
Gas price for nominated blocks, fixed based on the global average price at the hubs in the US, UK, Canada and Russia, has declined from $5 per million Btu to a low of $1.79 in six years.
Similarly, the price of Gas from Deepwater and other difficult areas though discovered through a bidding process, is subject to a cap/ ceiling of $3.62.
The Gas prices fixed or caped through Gas Pricing Formula are commercially neither viable for the existing gas producers nor attractive for new investors. Gas pricing policy needs a revisit to attract entrepreneurs and capital.
Long Term consistent assured production and supply of the Gas to the Industry is the Key to become a gas-based economy.Type your paragraph here.
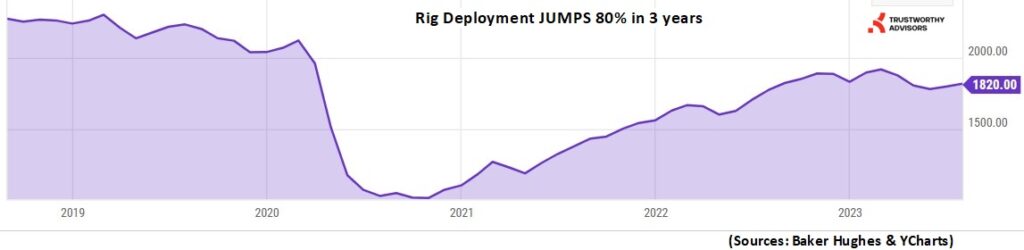
Rig Deployment Jumps 80% in 3 Years
1. Total World Active Rig Count, which had declined to almost half to 1018 during Covid period, has reached to 1820 in July 2023 as reported by Baker Huges.
2. The Oil & Gas Rig Count Index, prepared by Baker Hughes, is considered an important indicator of the oil and gas industry activity.
3. Unprecedented oil price crash to $20/ bbl in early 2020 resulted into the under-investment in the E&P and lower demand for the oilfield services for about two years.
The oil industry is now showing recovery with significant improvement in the oil price hovering around $85, even touched $120.
4. With increased demand for rigs, 90% of the Jack-up Rigs available in the market have been contracted. 75% of Drill-Ships and 60% of Submersibles are also deployed.
5. Higher demand has pushed up their Average Day Rates also to around $100,000 for Jack-up and $400,000 for Drill-ships & Submersibles as per S&P Global Commodities Insights.
6. The leading E&P companies and oilfield service providers are optimistic about oil price, oil demand, E&P spending, and field activity levels.
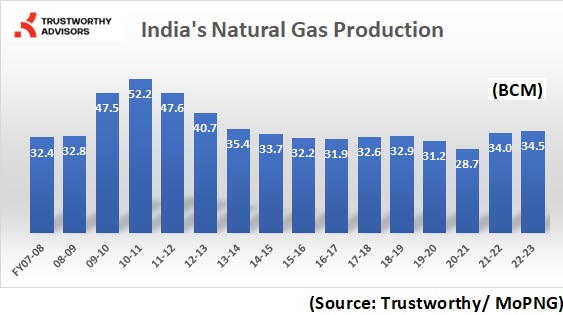
India’s Gas Production again on growth path:
1. Discovery of large gas reservoirs in 2003 in KG Basin Offshore in East Coast by Reliance and ONGC created Big Dream for India to make India a gas-based economy, by increasing the share of gas in the energy mix.
2. Gas based thermal plants, chemical industries, fertilizer units etc. came up.
3. Reliance D-6 which commenced production in 2009 reached gas production level of 60 million standard cubic meters of gas per day in 2010 and was expected to reach 80.
4. But suddenly started declining fast with unexpected reservoir behavior.
5. The gap could not be filling in by Reliance or other E&P companies. India’s Gas production continued to decline for 10 years from its peak at over 52 BCM in year 2010-11 to a low of below 29 BCM.
6. This created mismatch in Natural Gas growing demand and domestic production.
7. However, the production from KG Basin is now again ramping up since last two years with the renewed activities by Reliance-BP and ONGC.
8. Reliance- BP has started production from three fields: MJ, R- Cluster and Satellite Cluster. The three fields together are expected to produce around 30 million standard cubic meters of gas a day. ONGC is also likely to add around 15 mmscmd from East and West Coast.
9. The share of natural gas in India’s primary energy mix currently stands at around 6.5per cent as against the Global average of 24%. India has a target of 15% by end of this decade.
10. Achieving the Big Dream, however, requires focused efforts addressing challenges relating to gas pricing, policies stability and other issues to attract both Private and Public Sector for long-term investment.
ONGC’s largest offshore oil field, Mumbai High is producing continuously since almost five decades. It achieved peak production of 4.7 lakhs barrel oil per day in 1985. Production since then is declining. Currently producing 1.5 lakhs bopd.
ONGC has been doing redevelopment in phases to arrest the declining trend.
The field is spread over2000 square km in Mumbai offshore in the Arabian Sea. Mumbai High holds 14 billion barrels of oil initially in place (OIIP).
Recovery till date has been below 30%. Higher recovery is possible.
ONGC is looking for international expertise for
improving recovery and production performance